UX/UI Design — Internal Operations Platform
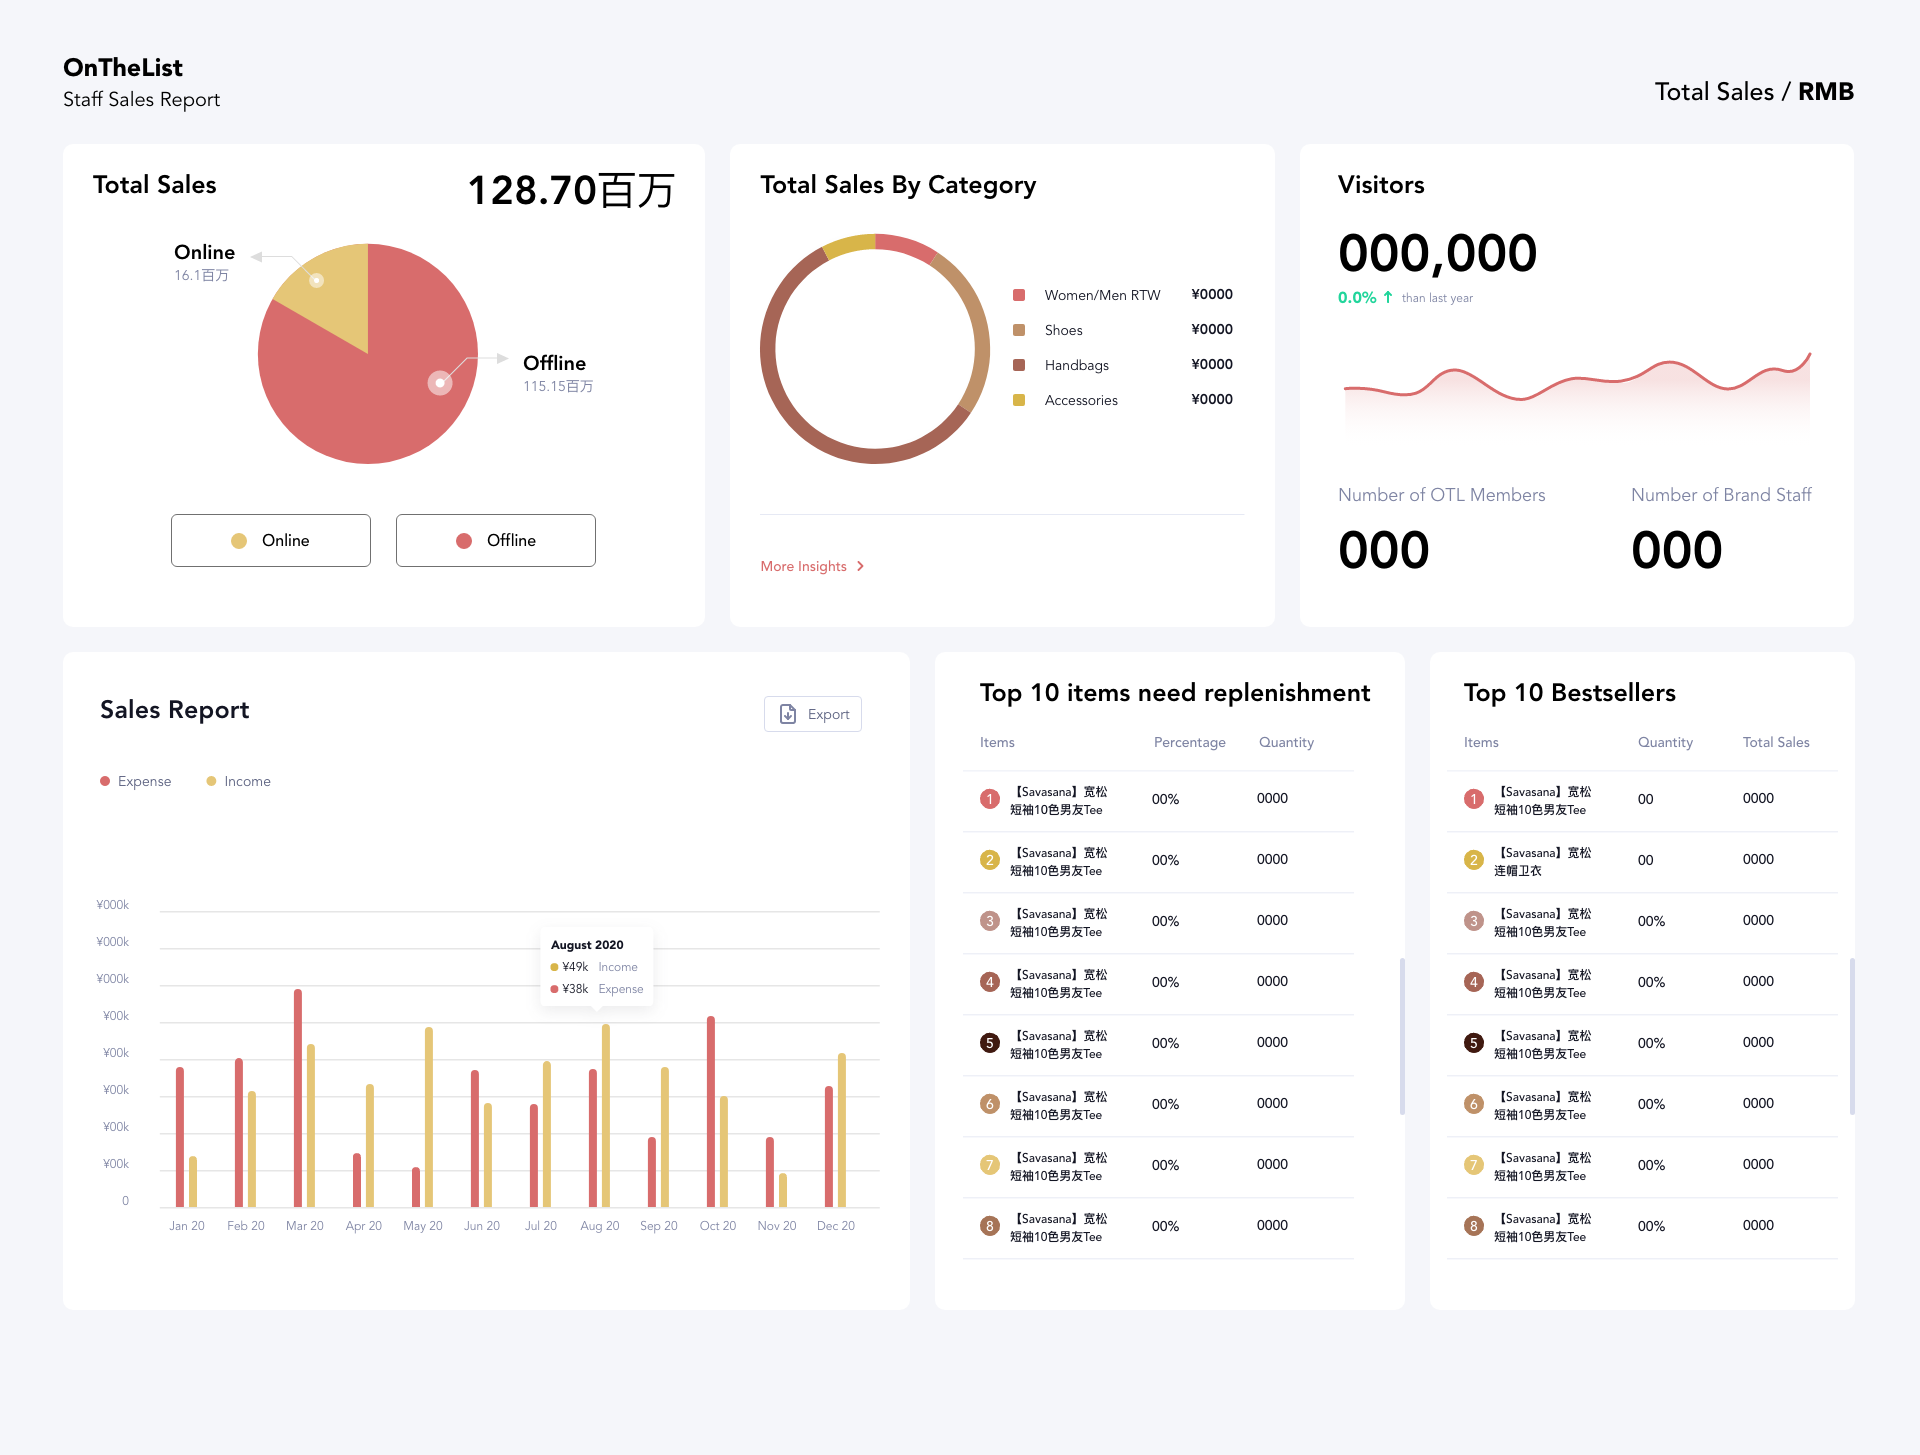
Designed a data-dense internal dashboard for non-technical operations staff to monitor daily revenue, category performance, visitor trends, and inventory replenishment needs. The challenge was turning fragmented backend data into a scannable, actionable interface.
The operations team needed a clear, daily view of store performance without having to dig through fragmented backend data. The dashboard gives non-technical staff a single, scannable interface to monitor daily revenue, category performance, visitor trends, and inventory replenishment needs — so they can spot issues and act quickly.
I led end-to-end UX from information architecture and wireframes to high-fidelity UI and a reusable component library covering colors, typography, tooltips, charts, and buttons. I embedded user feedback loops to refine filter logic and default views, reducing manual data-checking time for the team.
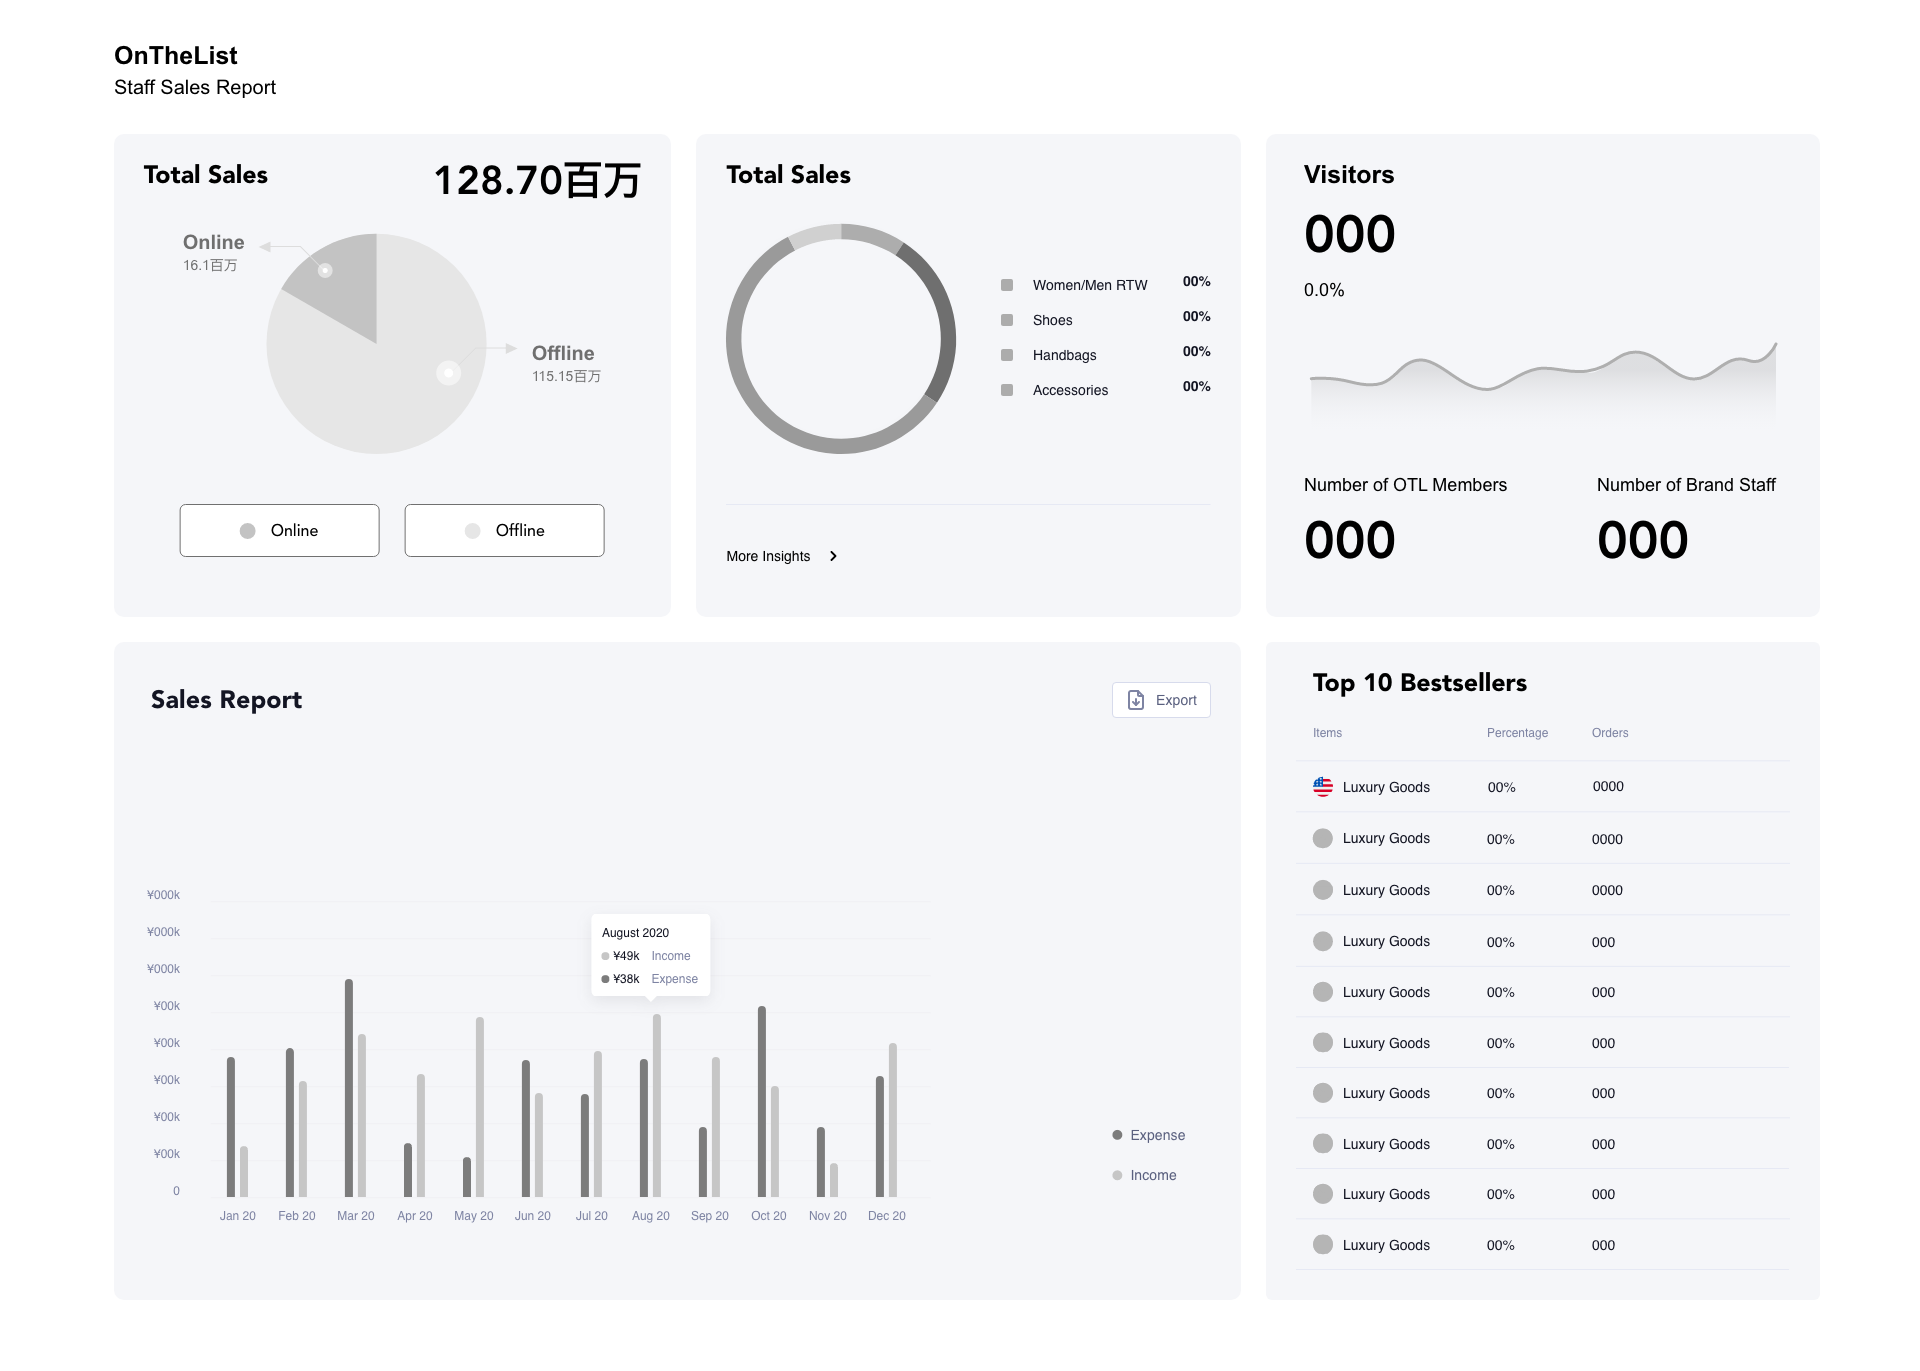
A reusable, neutral design foundation built to scale across future data modules.
| Module | Elements |
|---|---|
| Visual | Colors, Typography, Charts, Tooltips |
| Interactive | Buttons, Filters, Default Views |
| Data Modules | Sales Report, Category Performance, Top 10 Replenishment, Visitor Trends |
The final dashboard balances dense operational data with clear visual hierarchy, giving the team a fast, at-a-glance understanding of daily performance while keeping the interface calm and easy to scan.
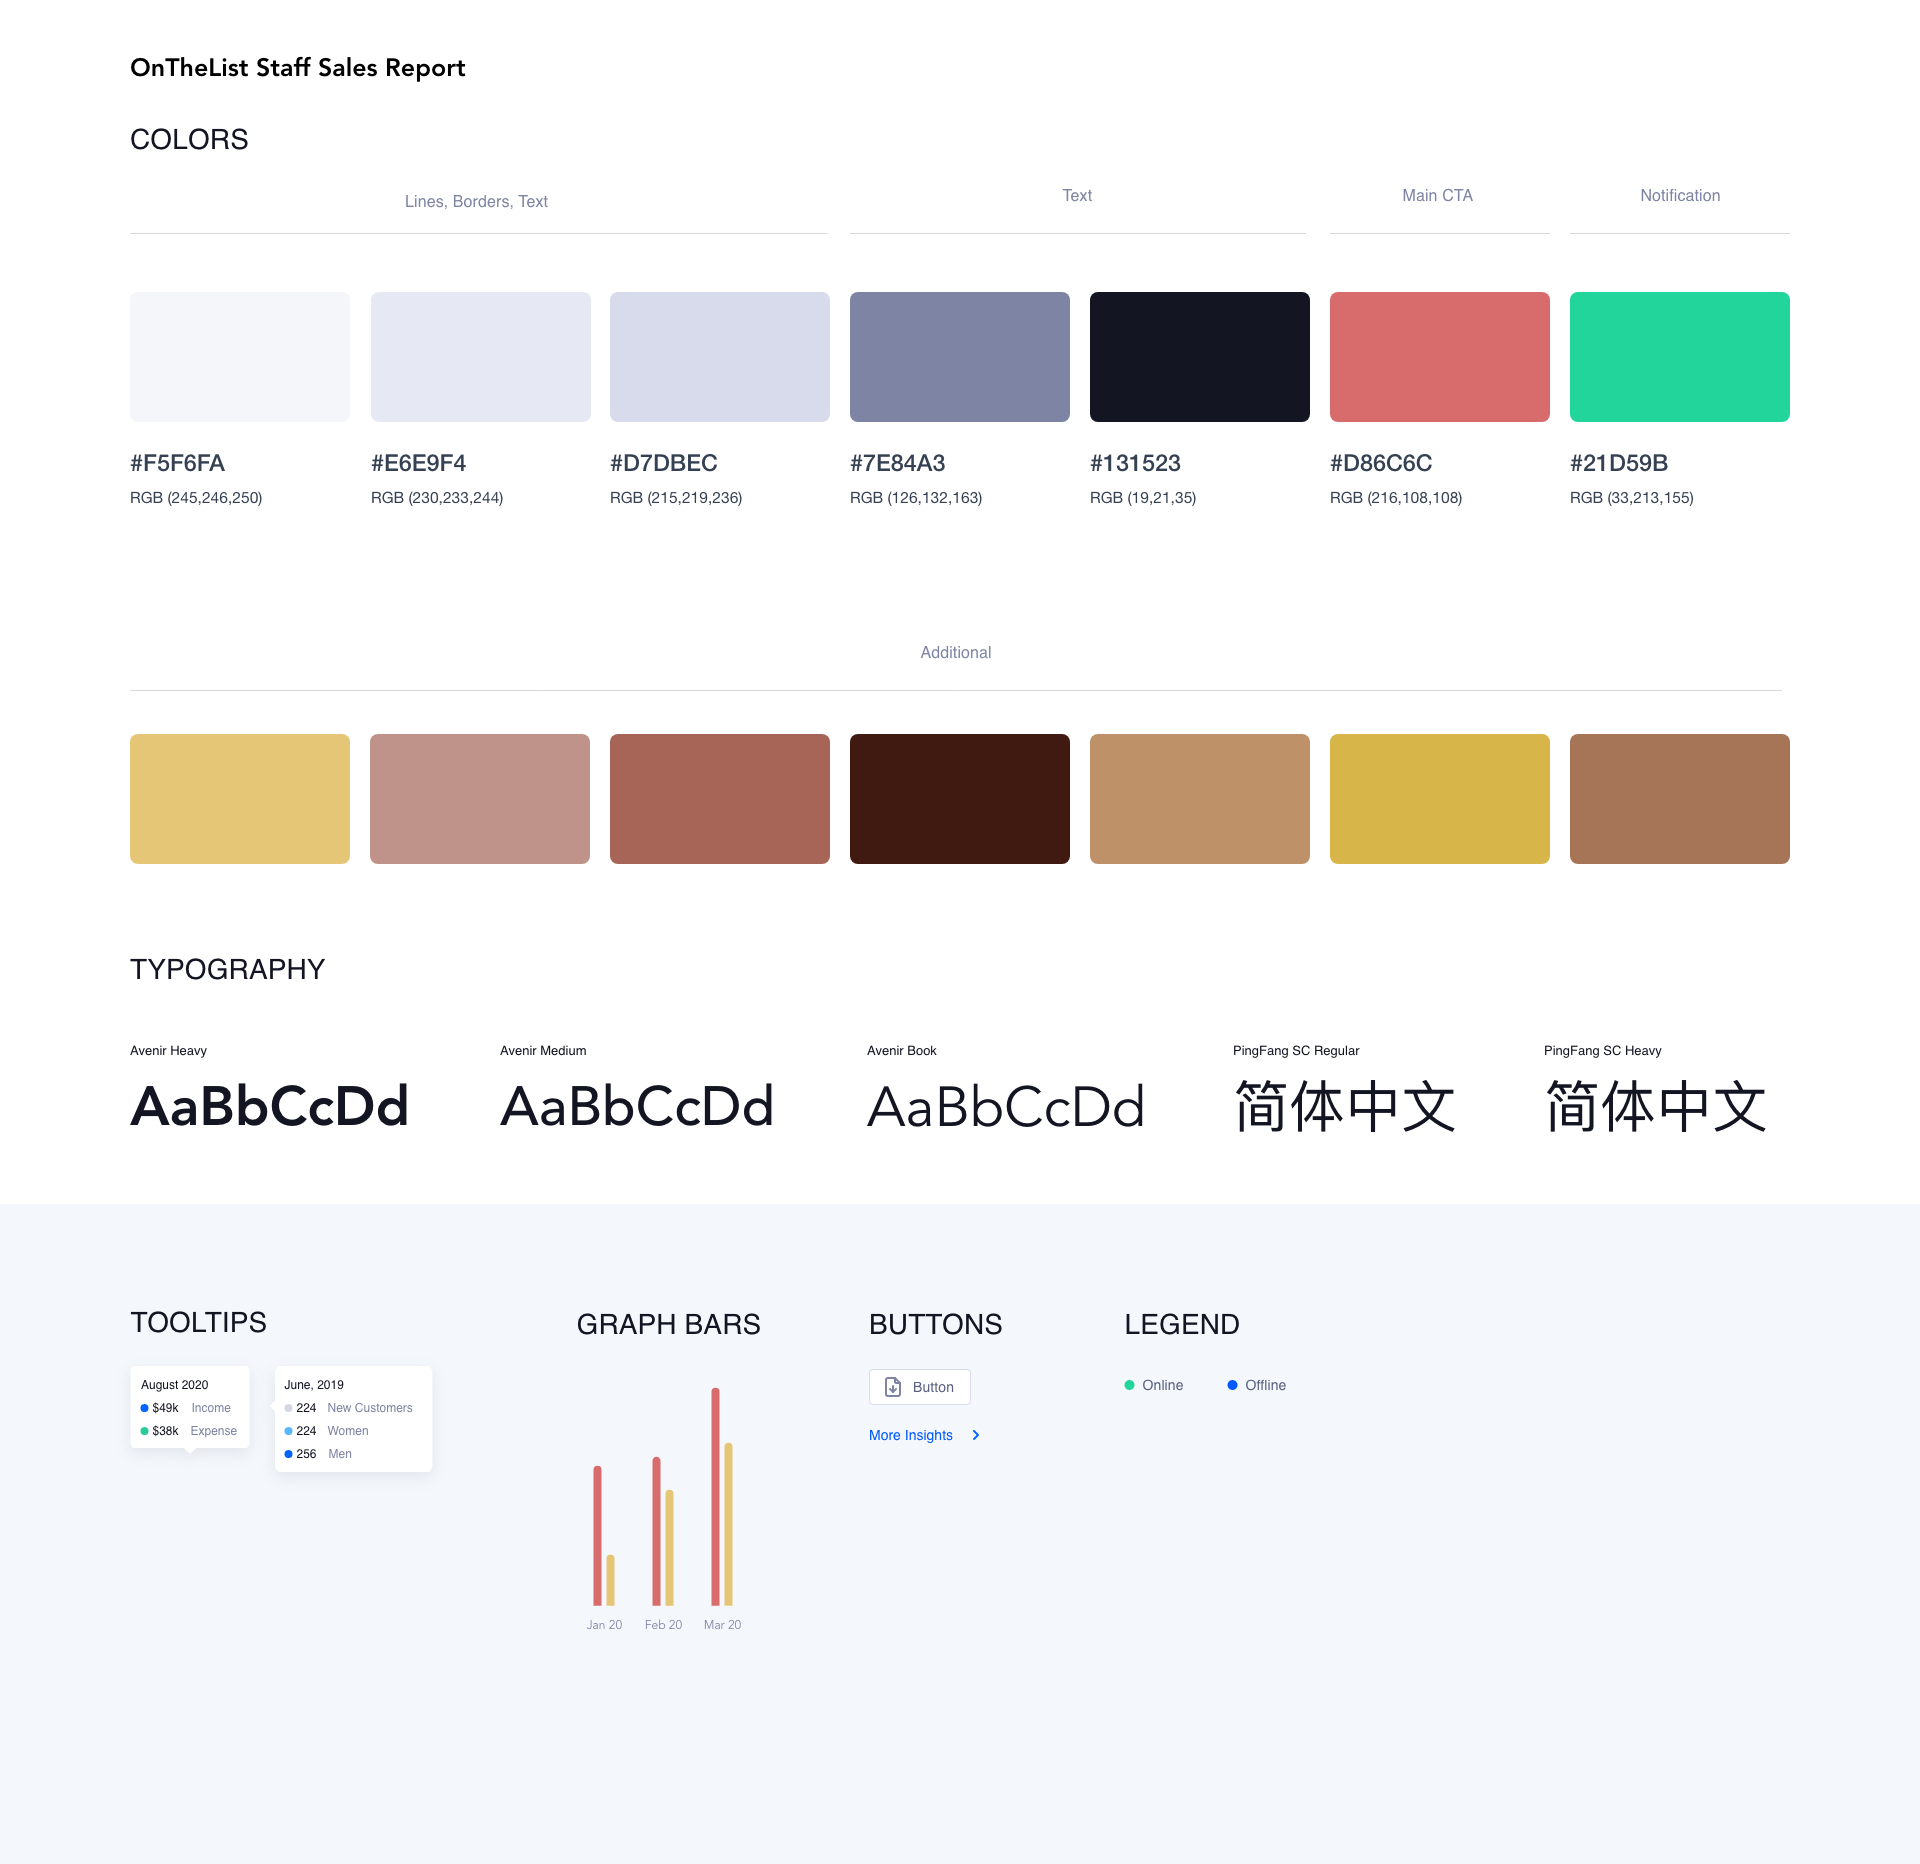
Embedding user feedback loops into the design process refined the filter logic and default views, ultimately reducing manual data-checking time for the operations team and enabling faster, insight-driven decisions.